Epidemic of thieving bankers

Photo-by-Ian-Davidson

Introduction
Why have so many well paid, highly educated men (and it is almost entirely men) working in financial services caught the disease of fraud and theft? There is manipulation of LIBOR and FX rates, alleged dubious dealings in derivatives, insider trading; even down to evasion of train fares. Is the infection caused by greed, hubris, poor leadership or a corrupting culture? What is to be done?
Environment
Financial services is one of the most heavily regulated, monitored and controlled environments. Yet, even allowing for the gross incompetence of the regulators, the level of wrongdoing is breath-taking. It is essential, for the survival of the already low levels of trust in financial services, that the infection of thievery and self-enrichment is tacked with the vigor of attacking an epidemic.
Are societal norms to blame? Over the last few years we have seen enormous growth in tax evasion, expense fiddling and influence peddling (and that is only the politicians). It is arguable that the environment among the well off and those who should be setting an example in society is that obedience to the rules, both the spirit and the letter is for the little people. Even when caught the response is often that nothing wrong has been done; it is the rules that are at fault or that the regulations are to be gamed to the highest extent to the advantage of the individual. In that context I guess that a little rate manipulation is seen as quite acceptable. Informal sub cultures have developed, despite all the regulatory training and people development: where criminal or near criminal behavior is not just acceptable but encouraged. The disease spreads tenaciously, secretively, hidden from the cleansing light of day until it is too late. Certainly Human Resources appear to have lacked any form of X-Ray vision to detect the wrongdoing not just at an early stage but at any stage at all.
The Epidemiological approach
It is time that an epidemiological approach to the problem is taken. Examination of the causes, spread, transmission and monitoring of the disease in the hope of finding a cure or eliminating the causes of this epidemic is necessary and timely. We have big data tools, masses of data, specific examples and outbreak centers’ – perhaps even a patient zero or two. Trying to kill the diseases by punishing the host (in this case by large fines on the banks paid for, ultimately by the shareholders) is akin to killing the dog in order to get rid of the fleas.
Consequences
If we do not take the epidemiological approach now we risk simply driving the behavior underground making it harder to find and with even more painful consequences for the bank customers and the little people who always seem to carry the cost burden be it via higher taxes, austerity or erosion of personal wealth. This is the winter of our discontent, it is time to let lose the weapons of disease control before it turns in to a cancer that destroys the entire body of financial services.

Complex can of worms – The Investment Association urge fund managers to divulge pay practices

Photograph-by-Ian-DavidsonIntroduction
The Investment Management Association has urged its members to disclose their pay policies and how this encourages alignment between investment teams and clients. At one level this is a worthy aspiration, particularly given the recent attacks on the industry by the Institute of Directors. On the other it is a smoke and mirror exercise to hide poor practice and misaligned reward. Anyone with any knowledge of the workings of financial services reward knows that broad principals often hide dirty details at the operational level.

Complexity, culture and competition
The publishing of generic pay policies cannot reflect the necessarily complexity of remuneration structures and practice in the investment management industry. Investment and asset management is, like the majority of financial markets, heavily segmented, heavily differentiated and deeply complex, There are considerable differences between the activities of an Equity Index fund, an active bond fund, a property fund and an active emerging markets equity fund. Their risk and reward profiles are totally different as is often the time frame in which they operate, There are multiple flavours of “funds of funds” as well as cross holdings of house and non-house funds with the occasional derivative overlay. Each and every segment will have a different reward strategy, outputs and labour markets. The industry has long ago moved away from “long only” strategies to complex and hybrid mixtures of long, short, derivative and real asset funds; all with very different revenue and risk profiles,

The characteristics of retail and institutional funds can be different as are their objectives. The maturity and fund flows also add layers of complexity to structuring remuneration. Some investment funds are nearer hedge funds than the traditional investment approaches with hedge fund like carry arrangements and performance fees. No one set of remuneration principals can cover the vast array of arrangements – often set on a fund by fund basis and changed every year,

Culture
As we have learned from the history of the many investigations in to financial services malpractice; culture can play a larger role in determining behaviours, reward and performance than any set of policies. A typical example is the on-going issues with LIBOR fixing. The “nod and wink” or the tacit acceptance by senior management that certain behaviours will not be noticed if a profit is turned is as frequent in investment management as it is anywhere in financial services. The same pressures on sales and fund performance exist in this industry as it does in, say investment and corporate banking. The amounts at stake are of eye watering size. In 2013 assets under management just in the UK were £6.2 trillion and that is before the recent uptick in world stock markets. The FT estimates that an average compensation cost per employee at global asset managers is US$263,000 and is set to overtake investment banking pay by 2016.
Regulation in the sector is growing and increasingly odious. However, as history of the recent past shows, the regulators are invariably behind the curve and just do not have the intellect or resources to catch up with changing remuneration and risk profiles in fast moving, innovative financial services industries.

Competition
The competition for star players in the investment and asset management industries are just as intense as in investment banking. Individuals and teams move houses with remarkable rapidity; given the alleged longer term horizons. The facts are that performance is measure over months, quarters and annually the same as it always has been. Despite regulation, lucrative transfer terms are still a very active activity in this market place. Again, there are few star performances and everyone knows who there are. The fight to retain and recruit talent from a limited pool is one of the major drivers of remuneration in this sector. A 2013 survey by Heidrick & Struggles in late 2013 noted that:
• 41% of respondents are actively recruiting
• 57% of distribution professionals are open to considering new opportunities
• 50% of survey respondents had changed jobs in the last three years
Dated as this survey is, the trend can only be upwards given the ever increasing amount of assets under management in the global marketplace as investors scramble for return in the long-term low interest rate return environment.

The amount paid to these star players cannot be overestimated, although small in number their remuneration can add up to a considerable percentage of the employee costs of an organisation. Thus the use of averages is, like most remuneration measurement in financial services, deeply misleading. The differentiation, the complex nature of packages, the uncertain future value of compensation awarded today means that even establishing a base line is fraught with methodological difficulty.

Remuneration policies
If you wanted to be mischievous; it would be fun to play buzzword bingo with investment and asset management remuneration policies. They all want to attract, retain and reward. They all want to create shareholder value within the risk appetite of the organisation. The vast majority will pay lip service to employee behaviors and risk management as counter-balances to pure performance measurement. Frankly, I could write a remuneration policy for any of these organisations in a relatively short period of time.
These policies hide a complex reality of highly diverse practices with a dazzling array of performance metrics (often differing between individual peers in the same team) that would take an actuary to calculate the outcomes; and that is before the inevitable horse trading around what the metrics actually mean and how they should be applied.

The remuneration policy will no doubt talk of alignment of interest with clients; but what does that really mean in practice? As one large institutional investor said to me only last week; she did not really care how the return was made provided she they hit their target benchmark. Other investors will have strict ethical guidelines or even religious considerations as constraints on the activities of the managers. Thus what aligns with one client requirements will be an anathema to another. Yet it may well be the same investment manager running both funds – what then is “alignment”?

Concluding can of worms
The request made to investment managers to be more open on their remuneration is a good try but no cigar. Being pragmatic, it may be seen as a sophisticated effort to ward off yet further regulation and statutory disclosure. The reality is that, like so much remuneration in financial services any potential “truth” is deeply hidden and can only be understood by seasoned professionals and remuneration analysts and even then on the basis of numerous, conflicting assumptions.
I know from experience that the world of asset and investment management remuneration is complex as a necessity. It reflects the fragmented, segmented complex world in which these organisations flourish and make a great deal of money.
Trying to reduce the environment to the level of disclosure of remuneration policy is perhaps something of a pointless, resource wasting and ultimately a counterproductive exercise.

Politicians, promises and payment by results

IAN_5014Labour1

Introduction
As the General Election in the UK comes to an end I was thinking about all the political promises, pledges and lists of broken guarantees. It struck me that the country could take a leaf out of the reward book and pay politicians by results. In this age of big data it would be easy to set up metric based targets for the five-year term of parliament. Then we could pay the politicians against their metric achievement. Judging from the large number of alleged financial scandals surrounding our MP’s and alleged comments from senior politicians such as Malcolm Rifkin about how poorly they are paid, financial reward certainly seems very high on the agenda of those who lead us.
Payment by results
Using a payment by results approach based around big data metrics and evidence based policy approaches would allow voters to easily measure achievement – or lack thereof, Likewise, it would be easy to see what pledges have been met or not.
The payment by results approach, designed by reward professionals, (who else?) and monitored by an independent body; for example the Institute for Fiscal Studies, who give credibility to the politicians promises and hopefully reduce the meaningless political rhetoric and general unpleasantness that has dogged this election campaign.
Effective opposition
The same approach could be used for opposition parties, effective challenge to the executive, votes won, policies implemented and the like.
Summary
Rather than having to wade through the swamp of claims, counterclaims, pledges and dodgy statistics we would have clear measures against KPI’s set for the five-year term. In addition perhaps politicians would stop moaning about their pay if, like those of use in business they were paid for their hard work and success; although on second thoughts….
#ge2015 #bigdata #reward #pay

Giving it away

IAN_5089

Question
You are sitting in your office when the CEO walks in. She says “I want to give half my salary away to increase the minimum pay in the organisation to $25,000.” Do you:
A) Burst out laughing?
B) Sit her down with a coffee and ask how long she has spent in the sun?
C) Start working out the new pay and the impact on the benefit costs?

Introduction
We have seen a couple of recent cases of exactly this happening. CEO’s taking a salary cut or turning down pay increases to fund either general increases or to raise the minimum pay in their organisation. What are the reasons behind this startling phenomenon? Guilt, publicity or an increasing discomfort with levels of pay inequality? Is the startling level of inequality beginning to cause discomfort to the high paid?

The facts
In the United States the top 1% of earners are paid 20% of total earnings. ( http://en.m.wikipedia.org/wiki/Income_inequality_in_the_United_States). The reverse of this coin is that 25% of jobs in the United States are low paid.

The issues
Pay inequality is largely perceived in relative terms: what we are paid compared to the colleague sat next to us. I remember giving a talk to HR in an investment bank. I told them average earnings in the UK were $35,000 and 62% of the UK population earned less than this – the team did not believe me. On checking, the average earnings in the room was $70 000 and the highest paid was $220,000.

Increasing inequality has, so far, had limited impact. We have seen the “Mac attack” on low pay in the catering sector, the occupy movement make occasional protests yet most carry on as normal. Sociologists argue that inequality leads to a breakdown of social cohesion and trust – but have we seen this?

The counter argument is simple. The labour market works and we are paid what we are worth. But, we know the market is tilted. If favours certain backgrounds, certain coloured skin and one sex over another. White male middle class high earners have largely done well in the last decade over, for example, black working class women. So, pay inequality is also an issue of social fairness.

What is to be done?
We have a number of options
A) Do nothing – the labour market more or less works and the alternatives are worse
B) Encourage an open and honest debate – but will it achieve anything?
C) Legislate – but state initiatives on pay seldom work and always lead to unfortunate consequences
D) As pay professionals start to ask questions about inequality of our CEO’s – but will they listen?

What do you think?

The Cobblers last, digital marketing and reward.

Introduction

  I was in a branch of Timpson recently where I noticed a cobblers last.  This is a rare sight.  I am old enough to remember when most shoe shops had them in the shop window; a bit like the three balls above a pawn brokers shop.  In reward we have a number of tools that go in and out of fashion like the cobblers last.

Recently I undertook a post graduate certificate in digital marketing with Google Squared in order to make sure that I was using the most up to date tools of the trade, particularly for reward communications.  I learnt a great deal about curation, the customer journey, the importance of content and the enormous power of digital communication in this world that has moved far beyond the technology of the cobblers last.    It also helped refresh my thinking of the roles of imagery, imagination, innovation and illustration in communication.


Reward’s digital cobblers last

There are a large number of tools available to reward professionals to help get the message across – particularly in a world very largely dominated by digital communication.  I have used You Tube videos to demonstrate total reward concepts, Podcasts to discuss the latest pay regulations (and the CIPD produced some very informative broadcasts).  And Twitter to publicise interesting reward web content.    Blogs, both written and video, are a very good way to publicise changes and new initiatives in reward.  The raw power of modern personal computers linked with cheap yet sophisticated software packages for producing excellent videos and technically proficient podcasts puts the creative process in the hands of most of us. 


A few months ago I contributed a chapter on risk and reward to a new HR eBook, edited by David D’Souza, an OD professional, called “Humane Resourced”.  This excellent collection of HR blogs stormed to the top of the HR best seller list at Amazon and was even a top ten selling business book on the same platform.  Such is the power of the new media that makes publishers, film makers and broadcasters of us all. 


Networking has been around since the days that humans learnt to communicate further than they could shout.  There are some excellent digital tools for networking such as Google Plus and LinkedIn.  These tools will not just allow you to communicate, but find like-minded people and relevant professional groups for you to meet and join.   There are communities of interests available on any subject; and if you cannot find one to fit your interests, set one up….  I have an interest (but little talent) in photography, largely in the niche field of police and military vehicles; yet my Flickr photography mini site has had over 130,000 views; such is the power of the digital.


Proper and appropriate use of social media and digital technology means that you can generate a consistent message, a new meme, or brand image to a diverse and large audience at little cost except the not inconsiderable time resource and mental commitment to the cause.


Corporate realities – the Empire strikes back

We all live in a corporate reality where blogs, videos, podcasts and the like are controlled by the marketing and PR departments who have a strong fear of brand contamination or social media embarrassment.    I have two responses to this; having a firm grasp of digital media tools will enable reward practitioners to go to the corporate gate keepers with ideas and imagination to kick start some new reward communications.  Second, and perhaps more open to debate, large organisations are, with a few noticeable exceptions, slow moving and not nimble in a fast moving social media world.  Perhaps, just perhaps, reward could help move the paradigm.


Alternatively you make think the entire subject is just a load of old cobblers lasts.  

Reward and Rock and Roll

Image

Introduction

What have the worlds of David Bowie, Black Sabbath and reward have in common apart from dealing  in large amounts of money?  An outstanding book, “The business of music”,,(http://www.academy-of-rock.co.uk/readnow/ ) by the renaissance man, Peter Cook, innovation Guru and rock musician, gives the answers.   Issues of creativity, innovation, communication and leadership have always been important in the reward leader’s toolkit.  Peter’s book provides an amusing but erudite Hayes instruction manual on these key areas.


The author – Peter Cook

I met Peter on the creativity and innovation module of my MBA.     He was leading an impromptu jam session by a group of senior managers to illustrate the nature of innovation and leadership. He is a polymath who is a gifted musician, writer, educator, consultant and social media expert.  But, he is also the most unusual of men who works in several different domains, yet manages to bring together these worlds of music, business strategy, innovation practices and writing with high energy and infectious enthusiasm.   His gift for story telling laced with personal anecdotes, key writings from the likes of Charles Handy and powerful metaphors make reading this book a joyous and educational experience.


Creativity and innovation

Peter uses the multiple reinventions of Kylie Minogue and David Bowie as lessons in innovation.  We can draw parallels in reward.  We need to constantly reinvent our products; if only as a response to the every changing regulatory and political environment.  As Peter points out it is just not enough to keep doing the same thing time after time and expect a different result.  Innovation is the art of taking the existing and making it more. 


I have a personal view that it is time for reward to reinvent itself from being a semi passive technical function to be more assertive, to set agendas rather than respond to them and to be less of a backing singer and move more in to the spotlight.


Another excellent musical example that he quotes is a group of jazz musicians improvising.  Each member of the group picks up and builds on the rhythms of the other group members while still maintaining the coherent soundscape.  This is another key skill in reward leadership.  We must improvise both on our own but also as a part of the HR and business team, while maintaining a constant internal and external harmony with our customers and stakeholders.


Communication

The Music of Business draws out some excellent lessons in communication.  As Peter points out, this is the soul of music:  talking to an audience, often at a deep, almost spiritual level.  Who has not got a favourite piece of music that conjures up some important memory or emotion?  Yet musicians and their producers tightly target the music at a very specific demographic segment.  I have an acquaintance, Tom Robinson who was a very successful musician (2468 Motorway and Sing if you’r glad to be gay for example).  Last year I attended a concert by him as EMI had re-released a new anthology of his music.  When I entered the concert venue the vast majority of people there were clones of me!  Tom’s appeal was to a very specific demographic – he has also reinvented himself as an equally successful award winning radio presenter.


The lessons for reward are clear.  We must clearly design and market our products for specific demographic segments.  We must communicate to our customers at the level of feelings and meaning as well at perhaps more superficial levels of value delivered.  Peter’s book gives excellent insights as to what good communication means and perhaps some technical hints as to how to carry out this communication at a deeper level.


Leadership

Peter writes engagingly on the subject of leadership.  It, alongside business strategy are at the heart of this book.  He quotes multiple examples and tells fascinating stories of both good and poor leadership.  He reflects on the musical leadership and longevity of some of the world’s top musical acts.  As technologies and tastes change many in the world of music have disappeared without trace (and think of the many companies who have done the same, or like Kodak perhaps failed to change with the times) yet others have not only survived but prospered as we have moved from vinyl through MTV to MP3 and beyond.


The parallels for reward are all too clear.  We must provide leadership that evolves with changes in the technological and regulatory environments.   Sometime this will mean revolution and sometimes reinvention.  Going along with the status quo is to go along with the dinosaurs


Business strategy

.Business strategy is at the heart of “The music of business.”.  Peter’s discussion on business strategy issues like strong culture range from the music of AC/DC to Marks and Spencer, taking in the writings of Michael Porter, Mintzberg and Andrew Sentance.  Peter gives equal weight to both the design of business strategy and also its execution.  He note examples of both good and poor strategy and execution.  It is clear that perfection in both is a requirement for success in business – music or otherwise.


The application to reward is clear.  We need a well thought out, innovative strategy with excellent and well thought out execution.  Most reward leaders are good at execution – but perhaps lag in the development of good business strategy.


Conclusion

The Music of Business is an engaging and erudite discussion on business strategy, creativity and innovation painted on the canvas of rock music.  It is a book you can dip in to or devour from cover to cover as I did.  It is the type of book that gets you thinking and may well take you off on unexpected journeys.


For those of us in reward it has some powerful lessons from outside our normal comfort zone.    My experience of the best reward leaders are those who think outside the box, have imagination and a strong cognitive framework in which to exercise their daily activities.   This book will help develop a different way of thinking and viewing the world – if only by creating a different mind-set about The Music of Business.


Reward fights back – peashooters against tanks, some closing thoughts

Image

Introduction

Unless you have been living in a monastery then you will aware that HR in the UK has been under attack on a number of different fronts by the media and by politicians. 


     The mauling given to the former BBC Head of HR

     The criticism over the high pay of senior managers in the charity sector

     Attacks on zero hours contracts

     Complaints on police PPO’s overtime payments


Much of the criticism has been aimed at the area of reward.  The quantum  of the BBC termination payments,  sizeable remuneration in the third sector even the discussion on low pay and zero hours contracts are clearly in the orbit of reward.  What has puzzled and dismayed me as a seasoned reward manager is the lack of a robust response on these issues.  Fleet Street knives have been sharpened and deployed against HR practices with very little parry from the profession or its leaders.


The issues

Let’s breakdown what is behind the political and media rhetoric.  All big organisations have enhanced termination payments in place.   Why?  First, if it is a true redundancy where there is no replacement of role, the payback on a redundancy payment is very rapid.  If you pay two years pay you are probably only paying 15 months costs of employment (let us not forget that employment costs also include all the infrastructure costs of offices, IT, administration support and the like) so you are very quickly in “profit”.  I have only once seen this argument put forward in the attacks on BBC HR.  Second, making a settlement agreement with an employee avoids costly legal disputes and reputational damage for both the organisation and the individual.  Not to mention the management time costs.  I have had some involvement with legal cases involving very senior managers having to sit around for hours at a time at court being totally unproductive, not to mention many expensive hours of briefings and the like with highly charging  QC’s.  Paying enhanced redundancy is very often in the interests of the organisation the stakeholders and the former employees.  So, why does nobody stand up and explain this?  I guess the facts do not make such good headlines.


We have seen the offensive (in both meanings of the word) being taken by politicians and the media over senior management pay in the charity sector.  Why has nobody shown the politicians the salary surveys and the head-hunter advice on the costs of employing senior management?  And, as a fan of big data I have to ask if anyone has produced the figures to show the large difference to an organisation that good leaders make in terms of both profit and success.    


I also notice some attacks in the media recently against the overtime being paid to the Metropolitan Police Personal Protection Officers who look after the Royal Family, the Prime Minister and the like.  These are very highly trained people – experts in their field with many years’ experience and very great skills.  The do a very difficult job very well in the vast majority of cases.  They may be required to put their life on the line for the people they protect – yet there are complaints about their overtime.  There has been no discussion that I have seen of the enormous value of their work or the circumstances that led to the requirement for long hours.  Why not?


There has been a lot of talk of both zero hours and low pay of late.  No one would deny that low pay is an issue.  But, it is a function of the labour market.  Increasing low pay is a social good but comes at an economic cost.  Politicians should not on one hand bemoan the erosion of working families incomes in the UK while at the same time urging employers to increase pay.  Such increases can only be paid for by raising prices.


Conclusion

You will, by now, have perceived the common theme.  Much of what is done in reward may not meet the highest moral standards, (and since when have either politicians or the media ever met that requirement); but our work is essential, commercial and pragmatic.  The labour market is imperfect, ambiguous and messy.  No amount of editorials or political band-standing is going to change those facts. 


One Head of Reward did point out to me when I was researching for this article that the targets of these attacks, the BBC, the police and the big charities, are all out of favour with the government and thus may be seen as legitimate targets.  She may say so, I could not possibly comment.


What is needed is a data rich, fact based discussion on these important reward questions by those who know and understand the issues.  We need a very big pea shooter to take on the storm troopers of the Westminster village and the chattering classes.  But it is time for reward professionals to do what they do best, provide the data and the analytics to take the battle in to the enemy camp.  Let us have a proper intellectual debate on these issues rather than the glass house occupants driving their tanks over the green lawns of the HR and Reward profession. 

IN CLOSING

I would urge you to buy/read the best-selling (#1 Amazon HR books) HR book  “Humane, Resourced” a crowd sourced ebook by some 50 HR professionals providing a cutting edge view of HR today by those who fight in the trenches.  I have honoured to have been a contributor to this volume.  All the revenue from sales of the book go to charity.  A very worthwhile read.   


This is my last reward blog post for a while.  I hope you have enjoyed the variety of topics covered over the last couple of years

Why our benefits products need to be like the Sainsbury supermarket

Introduction

 I was undertaking my weekly grocery shop in my local Sainsbury supermarket in Brentwood. It struck me that I have always shopped in this place. Why, and what lessons could be learnt that applies to reward offerings? The store gives me good value, consistency and familiarity.


Too often employee benefits are seen as an afterthought, an “add-on” to our pay strategy.  We can do much better than that. Employee benefits are an important signpost of both our employee proposition and organisational culture.  


Strong branding, good value, consistency

Sainsbury prides itself on its strong branding, good value and consistency. This is exactly what our benefit portfolio should be offering.  Our benefit products should reflect our organisational culture and values. Employee benefits provide a signpost to both employees and external stakeholders of organisational values. 


Good value is important. By which I mean the benefit is valued by the employee and drives business value creation by supporting and sustaining value added employee behaviours.  Consistency is also important. Employees should know what they are getting and benefit costs should be stable unless a revision is taking place. Consistency should also extend to culture. Giving a consistent and congruent benefits message supports and sustains our cultural memes


Product placement – the irritation factor

If you do your shopping like me, you are on autopilot; you know what you want and where everything is. However, every so often a ball comes from left field. The supermarket has moved my favourite jam. Panic.  I have to look around to see where it has been placed.  More often than not I see something I have not noticed before. Perhaps I will try a new jam? This again is like our benefit offering. On occasion we should move things around, shake them up a bit.  Just to get our employees thinking a little differently. 


Big data is watching you

I use a loyalty card at the supermarket. It is not the most streamlined of user processes.  However, it does mean that Sainsbury knows what I buy and when.  It can offer me money off coupons on things I normally buy and even tempt me with offers of things which I have not tried.  It knows what brand of aspirin I take, the stages of my children growing up and even how often I entertain It does not, in my view, make full use of this data; but it will.  These are valuable approaches we can use to enhance the personalisation of our benefit offering.  We can use the HR data to offer changes in risk benefit levels or pension and financial advice. All this is available and value added. It moves employee benefits from something staid to a dynamic, interesting, value added process supporting business success.


Visualisation and info graphics

I do not know, but if I was a betting man, I would place a wager that Sainsbury marketers and merchandisers use visualisation and info graphics to better understand the very large amount of data they hold. I can see in my imagination maps of the UK stores, showing geographic variations in value added products, perhaps with an Acorn (consumer classification) overlay. 


This is exactly what we should be doing with our employee benefits. Collect the data. Turn it in to meaningful visualisations.  Use these both as analytical tools but also to inspire creativity and innovation.  After all, why not?


Conclusion

There is a great deal to be said to applying the Sainsbury or Wal-Mart approach to our benefit products, services, and communication. The supermarkets make a great deal of money out of offering their customers what they want when they want it, at the optimum price. No doubt we can apply some of these lessons to benefits to build value, add credibility and build business success. 

Pay reviews; the Compa ratio magic. Strong Analytics V

Compa1

Introduction

We are, in most organisations, in pay and bonus round season. I have been involved in running pay and bonus rounds for over fifteen years.  One of the most helpful ratios and presentation tools is the compa ratio.  It is an incredibly powerful analytical tool.  At its most simple the compa ratio is the role is the position salary divided by the market salary.  This gives a ratio.  The magic is the amount of information contained in that number.  A compa ratio of 1 indicates that the position is paid at the market rate.  A ratio of less than one show the position is paid at less than the market rate and by what percentage and a ratio of more than one shows the position is over paid against the market and by what percentage.

By building graphs and visualisations of the compa ratios you have a powerful tool to assist management in making decisions on where to spend the limited salary increase resource.  Compa ratios can also be derived from total cash or even total compensation figures; although please see the methodological warning below.

What is it?

Most of us have salary data information from salary surveys.  We use this data to see how various positions sit in our labour market.   If I work in an insurance company I may have the excellent Mercer survey on insurance pay; if I work in banking I may very well use the methodologically sound McLagan survey.  Provided the jobs or roles have been correctly matched we will have a mass of market data on most of the roles in our organisation.  We will also have the average salaries for the same roles in our own organisation.

Here are some examples of comp ratio calculation:

Position salary Market salary Comp ratio
100,000 100,000 1 (Salary at the market position)
100,000  90,000 1.1 (Salary 10% above the market)
100,000 110,000 0.9 (Salary 10% below the market)

By using the simple compa ratio we will be able to see how our roles fit to the market.  Here is an example from a data set:

Role Average of Current Base Salary Average of Salary Compa
Actuary

$370,000

1.03

Management   Team

$370,000

1.03

Analytics analyst

$36,000

1.03

Analytics

$36,000

1.03

Analytics Manager

$100,000

1.01

Analytics

$100,000

1.01

Asst Trader

$47,648

0.94

Commodities

$41,603

0.95

EM

$29,347

0.96

OTC

$57,696

0.93

Special   Sits

$44,335

1.02

Treasury

$31,333

0.63

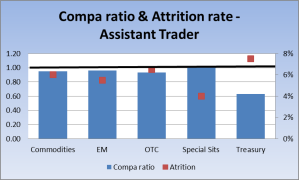
Here we have roles categorised by department with the compa ratio.  We can immediate see that there is an issue with the Assistant Trader role in Treasury.  At 0.63 we are clearly paying well below the market.  At best this warrants further investigation; at worse we have an immediate problem that should be prioritised in the pay increase distribution.   The concept becomes more powerful when we convert the data in to a graph

Image

In this example I have produced a graph showing both compa ratio and the attrition rate.  There is a strong negative correlation between compa ratio and attrition rate.

Getting clever

Using compa ratios it is possible to compare departments against one another as well as roles within a department.

Image

This shows the compa ratio by department; again illustrating where our pay round fire power should be concentrated.

The analysis can be extended to looking at sex discrimination, for example.  In this graph we look at the differences between males and females by compa ratio.

Compa3

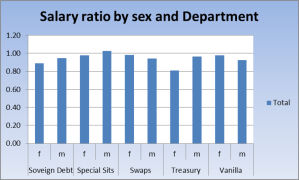
This chart again gives an indication of areas that will require to be considered when carrying out the pay review.

Making connections

Another very useful application of compa ratios is to compare department compa ratios against a range of business analytics.  So, in the table below I have compared compa ratio with return on risk capital.  The concept is to focus our pay increases on to those areas that give the best return for the business.

Department Average of Salary Compa Average of RORC
Political Risk

0.93

32.00%

M&A Advise

1.00

28.00%

Treasury

0.89

18.00%

EM Debt

0.99

14.00%

Special Sits

1.00

14.00%

Derivatives

0.97

12.20%

Swaps

0.95

8.20%

OTC

0.95

7.40%

FX

0.95

7.23%

EM

0.96

5.50%

Vanilla

0.94

3.50%

Grand Total

0.95

11.60%

This approach shows a low correlation between market position and return on capital of 32%.  Depending on our reward strategy we may wish to focus our pay budget on, for example, Political Risk which has the top return on capital but has a compa ratio below one, showing we are paying, on average, below the rate for the market.

Thinking bigger

A similar approach can be taken when using a compa ratio for “total cash” – that is salary plus annual cash bonus.

A word of warning

I will talk of some of the methodological issues later in the article; but of particular note is that great care must be taken when looking at total cash market survey results.  Survey organisations use different methodologies so be sure you are comparing like with like in terms of cash bonus definition and the timing of the payment of the bonus.

Combining data

One of the most powerful ways to use total cash compa is to compare base salary compa, total cash compa and, for example performance ranking or even better, a business KPI to ensure alignment of bonus payments with outcomes.

A common reward strategy is to place salary at the median of the market place but to pay bonuses at the upper quartile, or better, for upper quartile performance.

He is an example of a table of salary compa ratio, total cash ratio and return of risk capital.

Compa4

This is a very powerful analytic graphic.  It shows that there is a major mismatch between the areas achieving the best return on risk capital and the market position for both salary and total cash.  It further shows that two areas with very similar RoRC have different compa ratios for both salary and total cash.

We can carry on with this type of analysis with almost any business metric and any mixture of KPI’s and compa ratios.  It is a really powerful way to think about pay and bonus analysis.

Methodological warning

A major consideration when thinking about this type of analysis is that salary survey data relates to positions, not individuals.  Further, accurate job matching is essential to ensure a good “fit” to the data.  Salary surveys are best viewed as not absolute numbers but as indicating relativities in the marketplace.  It is more important to look at the relative position of a role than the absolute salary level.  This is because roles are different between organisations as are the people who fill them.

To use the compa ratio approach well requires a good understanding of the statistical methodology underlying the raw numbers, it advantages and its limitations.  We need to understand both the size of the data population and its stability.  Even quite large populations used for data can cause issues if that population changes year on year.  This applies both to the organisations taking part in the survey as well as the roles and the individuals within the roles.    Survey data is averages of samples; good statistical approaches can ensure that the samples closely resemble the total population; but in many cases there are no more or less than a sub-set.

This applies still further when looking at total cash survey data.  The definition of total cash and the age of the data are essential consideration when manipulating the analytical outputs.

Conclusion

When we are analysing data in preparation for the pay round the compa ratio is a very powerful analytical tool.  Used effectively it can give a great deal of data in a simplified format that is amenable to graphs, diagrams and info graphics.

Used in conjunction with business data it can create meaningful business insights that will shape and direct the nature of the pay and bonus round in your organisation.

If you would like to understand more about data analytics and the pay round please contact me at idavidson@rewardresources.net

Pay round visualisations – Strong analytics III

Image

Introduction

An important part of any pay review is reviewing pay.  That is looking at pay modelling, outputs and outcomes.  My experience says that the 80/20 rule applies.  80% of the pay round outcomes will be straightforward.  What will be of interest is the 20% of the population that comprises of exceptions and outliers.  So a good analysis will be layered to provide details on the total spend by department or area and the identification of outliers and exceptions.

The most effective way to provide this data is to do so using graphical data and info graphics.  Human beings assimilated graphical data far faster, in most cases, than vast spread sheets of data or even summary data in tabular form.  We like to look for patterns and at pictures when going through the sense making process.

The other very important piece of the presentational jigsaw is to show, wherever possible, the link to business metrics and key process indicators. (KPI’s).  It is very useful to show correlations between our reward outcomes and business metrics.  We must use the data to show our “bang for the buck”.  That we are spending shareholder money to best advantage.  This approach should be supported by reference back of the pay outcomes to our reward strategy.  So if our strategy is to pay our top performers at the upper quartile of our pay market we must show that correlation in our presentations.

Getting pay visualisation right saves time, effort and increases the credibility of the reward team.  It aligns the reward analysis with that of the organisation and its management.  Having a cohesive pay narrative, linked to business outcomes with make the “sell” of the pay round easier and faster.  Anticipating the questions of our stakeholders is both simple and powerful.

Exceptions and outliers

If the pay round is well structured management will have a focus on the exceptions and the outliers.  Identify the top and bottom ten per cent of your pay proposals.  Clearly identify those staff who are being rewarded outside the policy or in a different way to their peer group.  DO NOT provide pages of spread sheets or tabular summary data. (Unless specifically asked for by a stakeholder).  For most managers pages of data are difficult and time consuming to read and difficult to interpret.

This graph shows a correlation between revenue ranking and market position.  It is immediately oblivious that there is an outlier.  The reason for that person’s position on the graph can be explained and a recommendation made as to how to correct the anomaly and increase the correlation between revenue ranking and market position.  (The underlying assumption is that this is part of the pay strategy).
Revenue
 

Develop the pay narrative

As reward professionals, working closely with our HR business partner colleagues, we should have developed a coherent pay narrative.  A story of what our pay round is trying to achieve and what it has actually achieved.  The reason for this is that it makes explanation, presentations and data analysis much easier if we have started off with a basic, clearly expressed set of principles and assumptions.  This may include foreign exchange rate decisions, key metrics including the budgets and a clean set of data as a starting point.  Time spent cleaning pay data is never wasted and can save a vast amount of time and trouble later in the process.  Data is never perfect.  I have frequently come across situations where the headcount I was using for the pay review and the information in the Finance department was different.  Agree and reconcile the approaches and numbers before the pay round starts.

There is never enough time or resources to process a pay round perfectly.  By undertaking the data cleansing, agreeing the pay narrative and assumptions and any reconciliations in advance (and appreciating that is not always possible) will save time and lead to a better pay review process.

A picture is worth a thousand words, or ten spread sheets

Producing high quality, clear info graphics and visualisations of reward data is a very efficient use of resources.  Returning to the 80/20 rule it allows management to focus on the 20% of the pay review that is important or of interest to our stakeholders. Graphics such as the one below can be used to answer questions before they are even asked.  Using this approach highlights our exceptions and the extremes of our pay distribution.

The supporting data is of course available behind the graphics.  But, returning to the theme of a good pay narrative, we can illustrate and support both what we are hoping to achieve and what we have actually achieved.  A good graphic is a “smack in the face with the obvious”. A crude but accurate comment on what a good graphic should achieve.

Business metrics and KPI’s

It is no longer enough just to present raw pay data.  We have to put the information in to the business context.  We must illustrate the connections and correlations between our limited pay and bonus budget and business outcomes.  Reward the performers and the revenue generators.  Pay outcomes can be used to give a clear message as to what behaviours and activities will be reward and those which will not.   Many organisations, even those in financial services, are looking carefully at the “how” something is achieved as well as the “what”.  Balanced scorecard approaches are very common; it is still possible to focus on the financial outcomes by giving it a high scorecard weighting; but we can nuance the approach by giving smaller weightings to cultural, behaviour and approach.  A well-constructed balanced score card will be measurable and give another basis for our graphics to show appropriate correlations.
Blog pic 3

In an earlier post (https://iandavidson.me/2013/08/23/pay-round-processes-a-big-data-approach-including-the-add-on-benefits-to-recruitment-training-and-development-and-succession-planning/) I showed how it is possible to run a pay round based almost entirely on those factors that lead to business success.  It is not easy and arguably it removes “discretion” from managers.  But, it is the use of that very discretion that often leads to upset and even legal challenge.  A robust process backed by robust data is the way forward.

blog pic 7

Conclusion

The pay round in the vast majority of organisations is resource and time constrained.  It can be made easier on all stakeholders by presenting a solid reward narrative illustrated and supported by appropriate and timely visualisations.  This allows the focus of the reviewing stakeholders, be they the Remuneration Committee, Executive management or line management, to be on the 20% of the population that requires attention rather than the 80% that does not.

A strong story, answering questions before they are asked and linkage with business metrics will be both appreciated as part of the alignment of HR and business strategy and as an efficient way to manage a pay round.  Providing good graphics saves time and increases focus when resources are, like high pay increases, very rare.